Example Presentation
Create beautiful interactive slide decks with Reveal.js
Hello, There
This presentation has a handful of slides which can be used to demonstrate the pointer extension.
Press ‘q’ to enter and exit the pointer mode.
Pretty Code
- Over 20 syntax highlighting themes available
- Default theme optimized for accessibility
# Define a server for the Shiny app
function(input, output) {

  # Fill in the spot we created for a plot
  output$phonePlot <- renderPlot({
    # Render a barplot
  })
}
Learn more: Syntax Highlighting
Code Animations
- Over 20 syntax highlighting themes available
- Default theme optimized for accessibility
# Define a server for the Shiny app
function(input, output) {

  # Fill in the spot we created for a plot
  output$phonePlot <- renderPlot({
    # Render a barplot
    barplot(WorldPhones[,input$region]*1000,
            main=input$region,
            ylab="Number of Telephones",
            xlab="Year")
  })
}
Learn more: Code Animations
Line Highlighting
- Highlight specific lines for emphasis
- Incrementally highlight additional lines
import numpy as np
import matplotlib.pyplot as plt

r = np.arange(0, 2, 0.01)
theta = 2 * np.pi * r
fig, ax = plt.subplots(subplot_kw={'projection': 'polar'})
ax.plot(theta, r)
ax.set_rticks([0.5, 1, 1.5, 2])
ax.grid(True)
plt.show()
Learn more: Line Highlighting
Pointer on top of figure
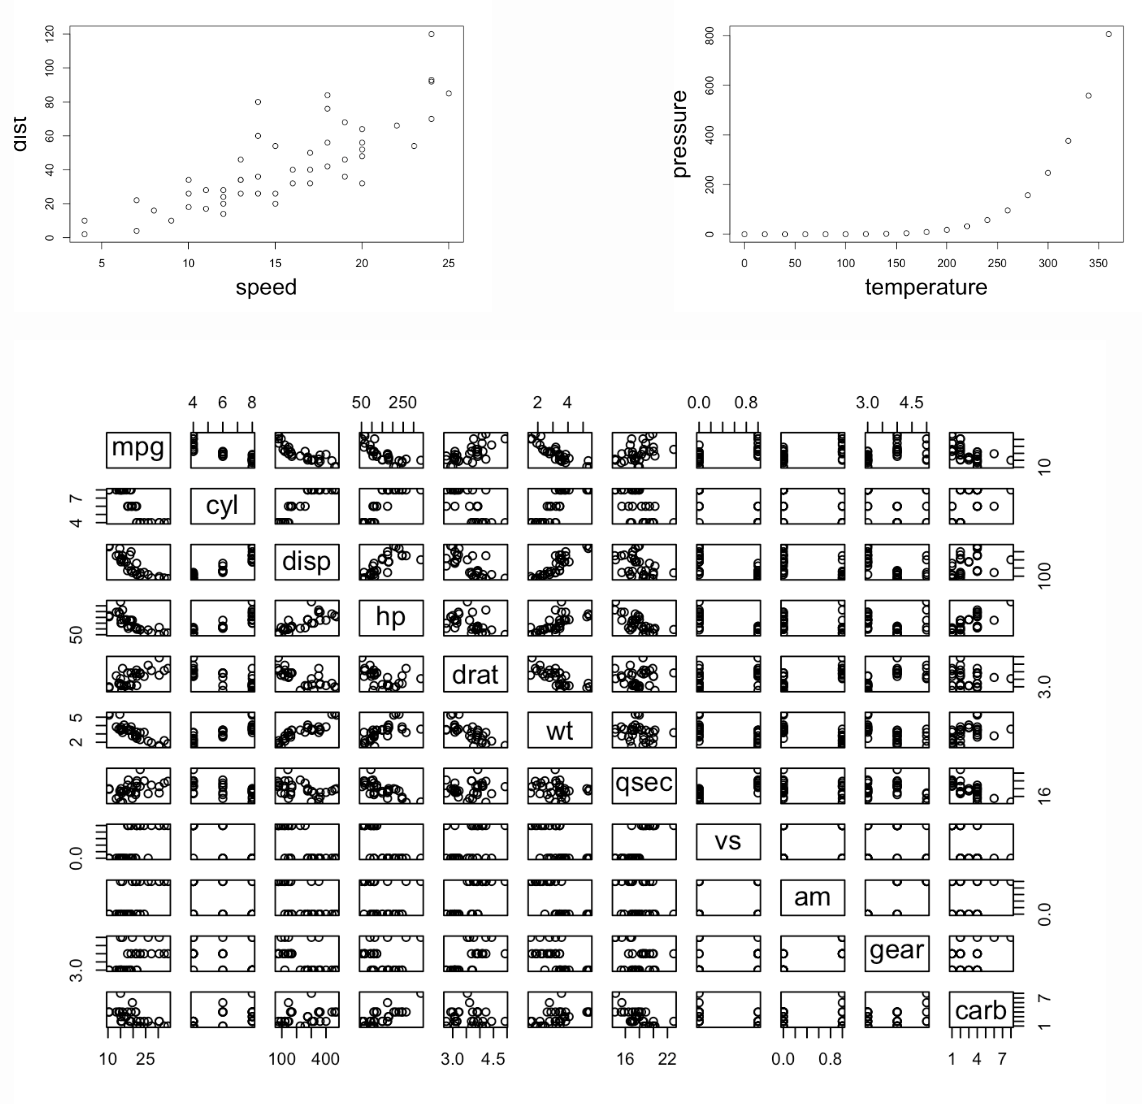
Example