
import pandas as pd
import matplotlib.pyplot as pltIn [1]:
Import la-palma.csv - a clean subset of catalogoComunSV_1663233588717.csv:
In [2]:
df = pd.read_csv('la-palma.csv')
df['DateTime'] = pd.to_datetime(df['DateTime'])
df = df.sort_values(by=['DateTime'], ascending=True)
df.head()| Longitude | Latitude | Depth(km) | Magnitude | DateTime | |
|---|---|---|---|---|---|
| 11346 | -17.8349 | 28.5346 | 26.0 | 1.6 | 2017-03-09 23:44:06+00:00 |
| 11343 | -17.8459 | 28.5491 | 27.0 | 2.0 | 2017-03-10 00:16:10+00:00 |
| 11344 | -17.8863 | 28.5008 | 20.0 | 2.1 | 2017-03-10 00:16:11+00:00 |
| 11345 | -17.8657 | 28.5204 | 30.0 | 1.6 | 2017-03-10 03:20:26+00:00 |
| 11342 | -17.7156 | 28.5985 | 0.0 | 1.6 | 2017-08-21 02:06:55+00:00 |
In [3]:
df.describe()| Longitude | Latitude | Depth(km) | Magnitude | |
|---|---|---|---|---|
| count | 11347.000000 | 11347.000000 | 11347.000000 | 11347.000000 |
| mean | -17.844062 | 28.568893 | 14.089345 | 2.432423 |
| std | 0.027345 | 0.021899 | 8.624787 | 0.705282 |
| min | -17.995800 | 28.310200 | 0.000000 | 0.200000 |
| 25% | -17.854100 | 28.558000 | 10.100000 | 1.900000 |
| 50% | -17.838700 | 28.564000 | 11.300000 | 2.600000 |
| 75% | -17.829700 | 28.574300 | 13.900000 | 2.900000 |
| max | -17.705700 | 28.697800 | 46.900000 | 5.100000 |
In [4]:
df.plot.scatter(x="Longitude", y="Latitude", figsize=(12,12), grid="on");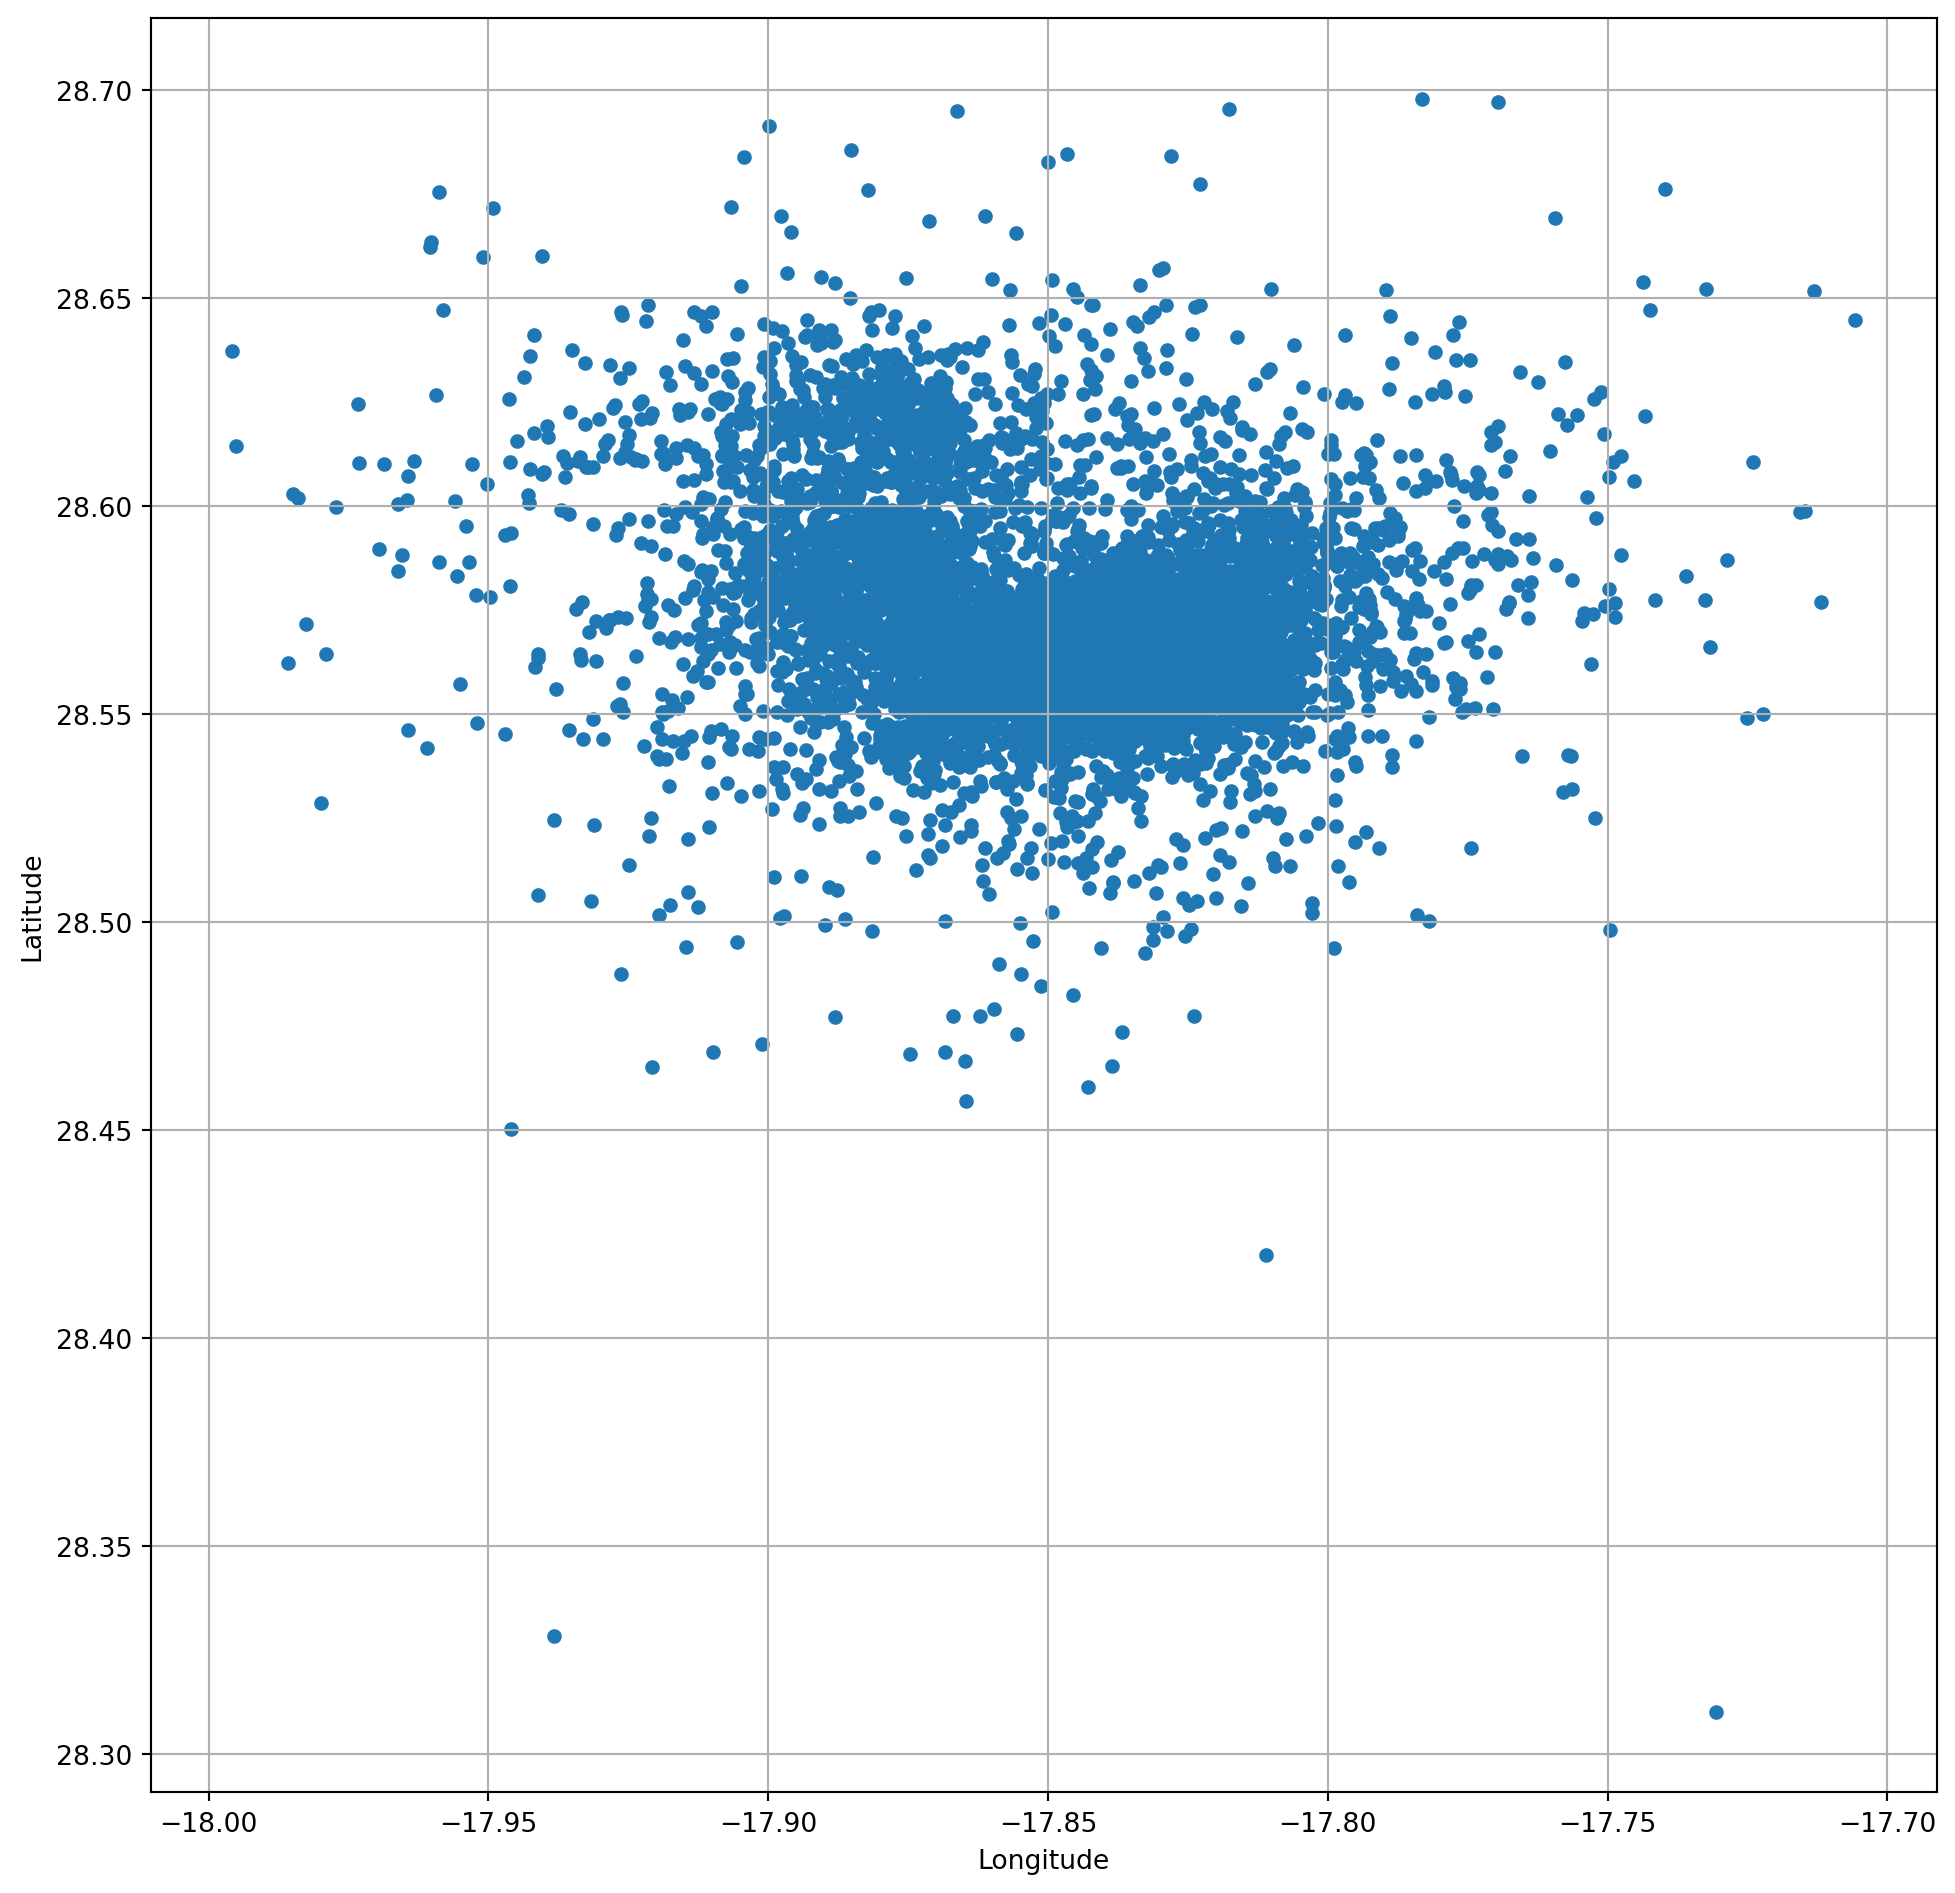
Filter
Also some rows seem to be missing depth measurements, (see differences in the count for columns above) - take only rows with valid depths
In [5]:
df = df[df['Depth(km)'].notna()]
df.describe()| Longitude | Latitude | Depth(km) | Magnitude | |
|---|---|---|---|---|
| count | 11347.000000 | 11347.000000 | 11347.000000 | 11347.000000 |
| mean | -17.844062 | 28.568893 | 14.089345 | 2.432423 |
| std | 0.027345 | 0.021899 | 8.624787 | 0.705282 |
| min | -17.995800 | 28.310200 | 0.000000 | 0.200000 |
| 25% | -17.854100 | 28.558000 | 10.100000 | 1.900000 |
| 50% | -17.838700 | 28.564000 | 11.300000 | 2.600000 |
| 75% | -17.829700 | 28.574300 | 13.900000 | 2.900000 |
| max | -17.705700 | 28.697800 | 46.900000 | 5.100000 |
In [6]:
plt.figure(figsize=(20,6))
plt.subplot(1,3,1)
df["Latitude"].plot.hist(bins=20, density=True)
plt.subplot(1,3,2)
df["Longitude"].plot.hist(bins=20, density=True)
plt.subplot(1,3,3)
df["Depth(km)"].plot.hist(bins=50, density=True)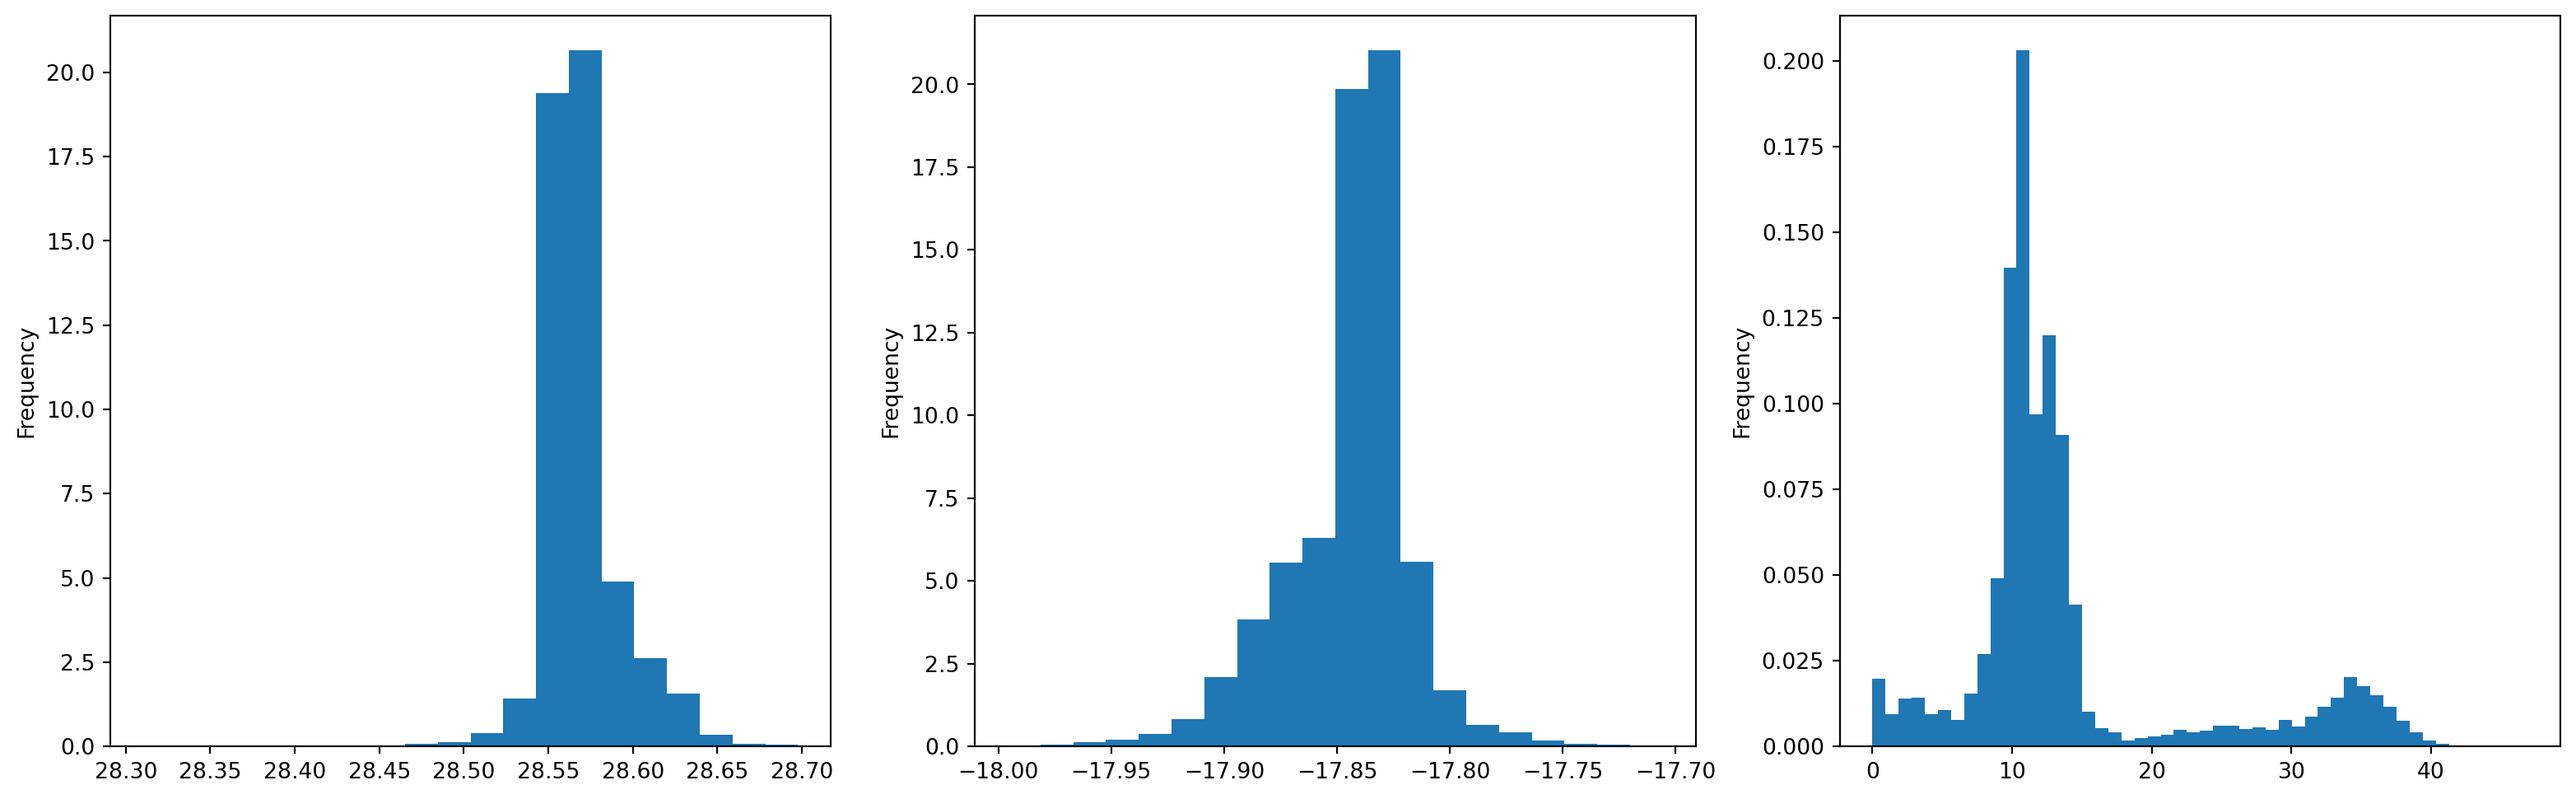
Spatial Plot
Scatter plot the spatial locations of events
In [7]:
#| label: fig-spatial-plot
#| fig-cap: Locations of earthquakes on La Palma since 2017.
#| fig-alt: A scatterplot of earthquake locations plotting latitude against longitude.
from matplotlib import colormaps
cmap = colormaps['viridis_r']
ax = df.plot.scatter(x="Longitude", y="Latitude",
                     s=47-df["Depth(km)"], c=df["Magnitude"],
                     figsize=(12,10), grid="on", cmap=cmap)
colorbar = ax.collections[0].colorbar
colorbar.set_label("Magnitude")

plt.show()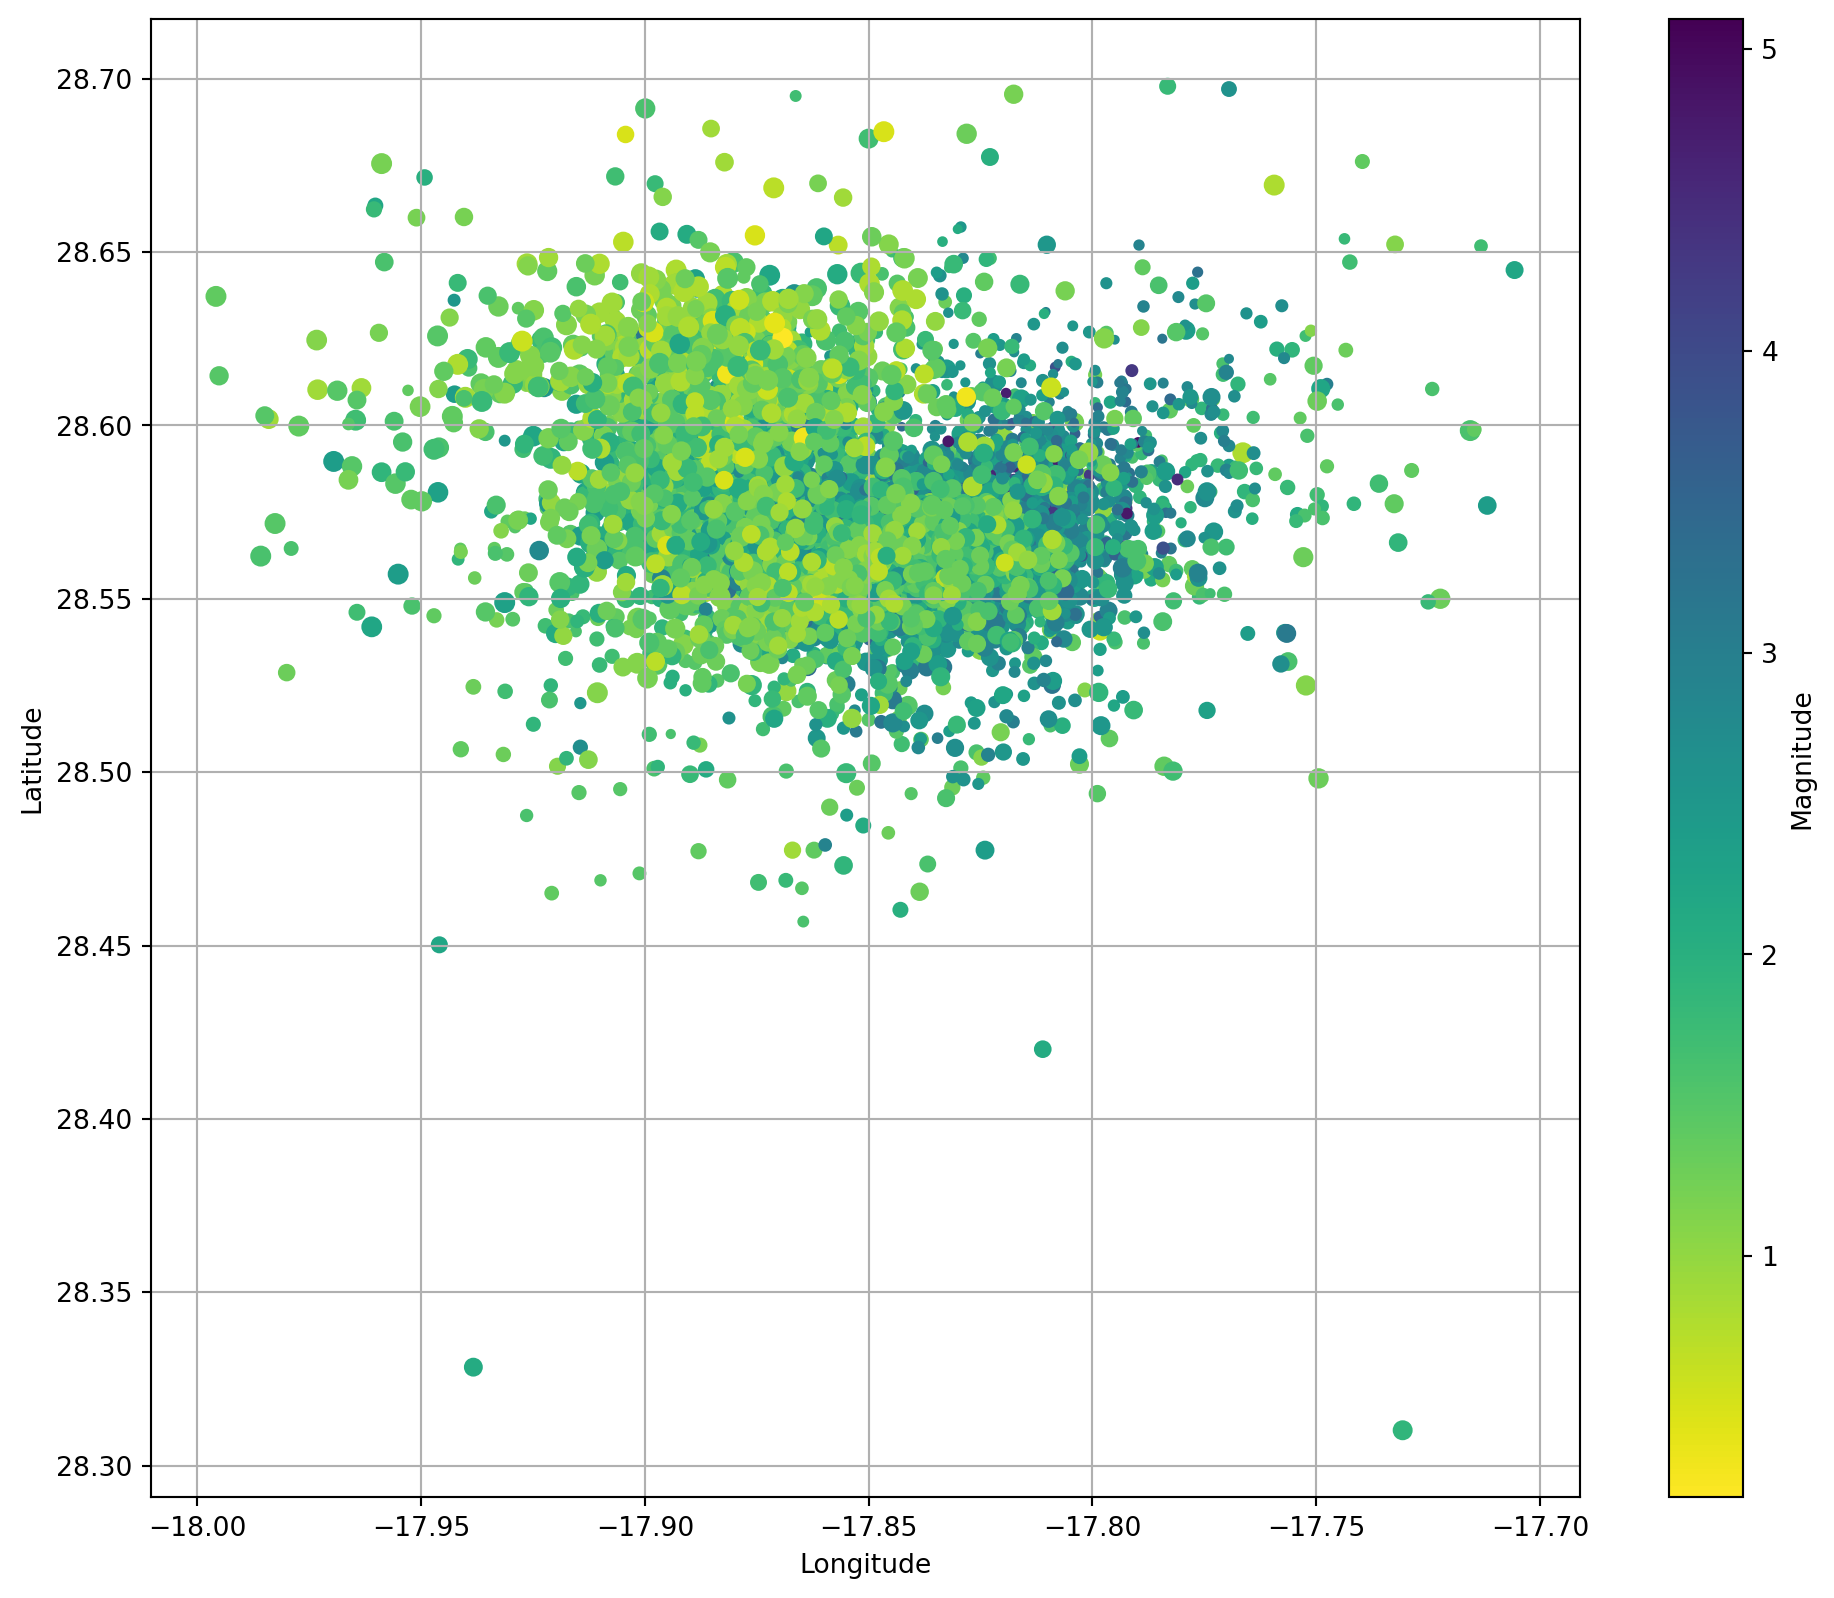
Timeline Plot
Scatter plot the event time series and look for any quantization issues. Have times & dates been loaded correctly?
ax = df.plot.scatter(x=‘DateTime’, y=‘Depth(km)’, figsize=(20,8)) ax.set_ylim(50,0);